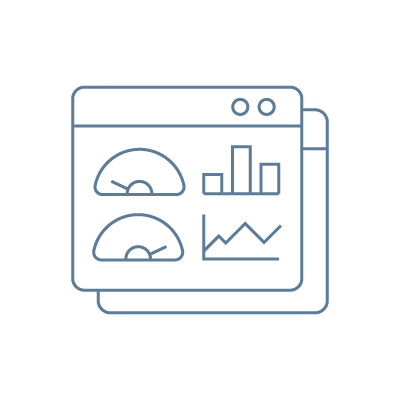
Consulting Services

Dashboard Development

The Problem

Your Data Exists. Your Decisions Shouldn't Depend on Guesswork.

In today's business environment, data analytics and business intelligence are no longer optional, they are the difference between leading your market and reacting to it.

Yet most businesses are still making decisions based on gut feel, delayed reports, and disconnected spreadsheets.

If any of these sound familiar, you have a data problem that is costing you money right now:

The result: increased costs, missed opportunities, and decisions made on incomplete information.

Our-Solution

Our Solution

Your Data, Visualized and Simplified

We design and build custom business dashboards tailored to your specific operations, metrics, and decision-making needs. Not generic templates.


Not one-size-fits-all tools. Purpose-built dashboards that show you exactly what you need to run your business with confidence.


We turn your data into decisions so you can stop reporting on what happened and start acting on what's happening.

What You Get

Centralized View

All your business data in one place, no more hunting across systems

Interactive Visualizations

Dynamic charts, graphs, and heatmaps that make complex data instantly readable

Real-Time Insights

Live data feeds so decisions are based on now, not last month

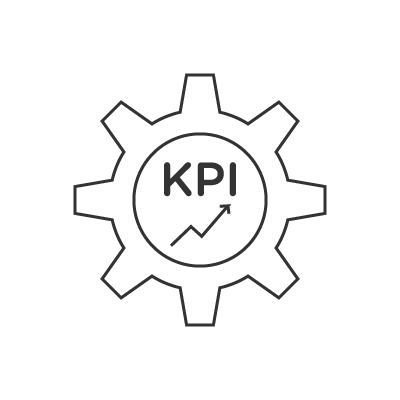
Custom KPIs and Metrics

Built around the numbers that actually drive your business

Automated Reporting

Eliminate manual report preparation and free your team for high-value work

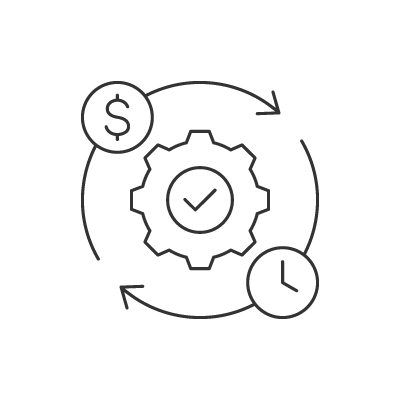
Enhanced Operational Efficiency
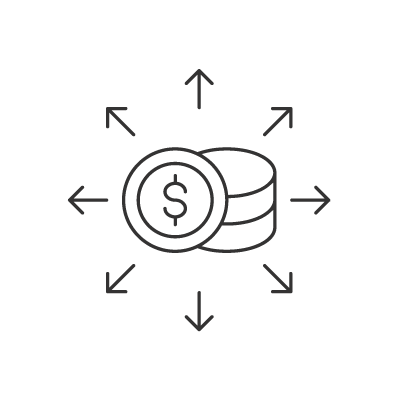
Identify bottlenecks, track performance, and act with precision

The Business Impact

Our dashboards help businesses cut costs by 10–20% within 3–6 months while boosting revenue through faster, smarter decisions.


Here is what that looks like in practice:

We turn your data into decisions so you can stop reporting on what happened and start acting on what's happening.

Boost Revenue

Data-driven decisions that directly improve profitability

Save Time

Automated reporting that converts hours into minutes

Eliminate Guesswork

Turn raw data into precise, actionable strategies

Track ROI & KPIs

Measure success with accurate, dynamic analytics updated in real time

How We Build It

The 6-Phase Dashboard Implementation Process

We don’t hand you a template and call it a dashboard.

Every engagement follows a rigorous 6-phase process designed to produce a tool that works for your specific business from day one.

We start by understanding your business deeply, defining the KPIs that matter, mapping your reporting processes, and reviewing your existing data systems. No assumptions. Just a clear picture of where you are and what you need.

Good dashboards require clean, reliable data. We validate your data sources, assess quality, and structure your data for seamless integration, so what your dashboard shows is always accurate and trustworthy.

We design tailored analytics and dashboard layouts built around how your leadership team actually thinks and works. Every visual, every metric placement, every filter is intentional, clarity is the goal, not complexity.

We connect your data sources, model relationships between data sets, and automate data flows so your dashboard updates without manual intervention. Your data works for you around the clock.

A dashboard is only as powerful as the people using it. We equip your team with the training they need to navigate, interpret, and act on their new dashboard with confidence, and we gather feedback to make final refinements before go-live.

We configure the right permissions and access levels across your organization, then hand over a fully operational, live dashboard. Your team is equipped. Your data is flowing. Your decisions just got faster.

Results

Results That Speak for Themselves

Our dashboards have delivered measurable results across industries in the Middle East and beyond. Here is what our clients have achieved:

Food & Beverage Industry

  • 20% increase in sales
    20%
  • 10% decrease in marketing expenses
    10%

The dashboard enabled dynamic campaign performance tracking and better resource allocation, giving the marketing team the visibility to cut waste and double down on what worked.

Healthcare Industry

  • Data availability increased by 30x
    100%
  • 80% rreduction in time spent on analytics
    80%

Real-time tracking of utility expenses, customer feedback, and P&L reports replaced a fragmented manual process, giving leadership a complete operational picture at any moment.

Automotive Industry

  • 15% reduction in supply chain delays
    15%
  • Improved on-time delivery metrics across the board
    100%

The dashboard enabled real-time tracking of shipment statuses, vendor performance, and inventory levels, turning supply chain visibility from a problem into a competitive advantage.

Engineering & Construction Industry

  • Report preparation time reduced from 5 hours to 4 minutes
    100%
  • Project overruns reduced by 10%
    10%

Seamless integration of project KPIs and financial metrics gave project managers the real-time control they needed to catch problems before they became overruns.

Why Dunamis for Your Dashboard?

20+ Years of Expertise

Deep experience in project management, controls, and data systems

Proven at Scale

Our dashboard solutions have been implemented across 36 Ministries and Government Entities in Saudi Arabia

Trusted Expertise

We have delivered high-impact solutions across F&B, healthcare, automotive, construction, retail, and government sectors

Full-Service Support

Dashboard development is one part of a broader consulting capability: we can help you fix the operational problems your dashboard reveals

Ready to see your business clearly?

Let's build your dashboard

Chat Icon